Charts and Overviews
Project progress, communication, deals, ordered products, and more
AyMINE provides charts that offer a quick overview of the company's status and progress.
Find summary overviews of work based on generated data.
Access real-time overviews from live data.
View insights in charts, and export them into your preferred formats as needed.
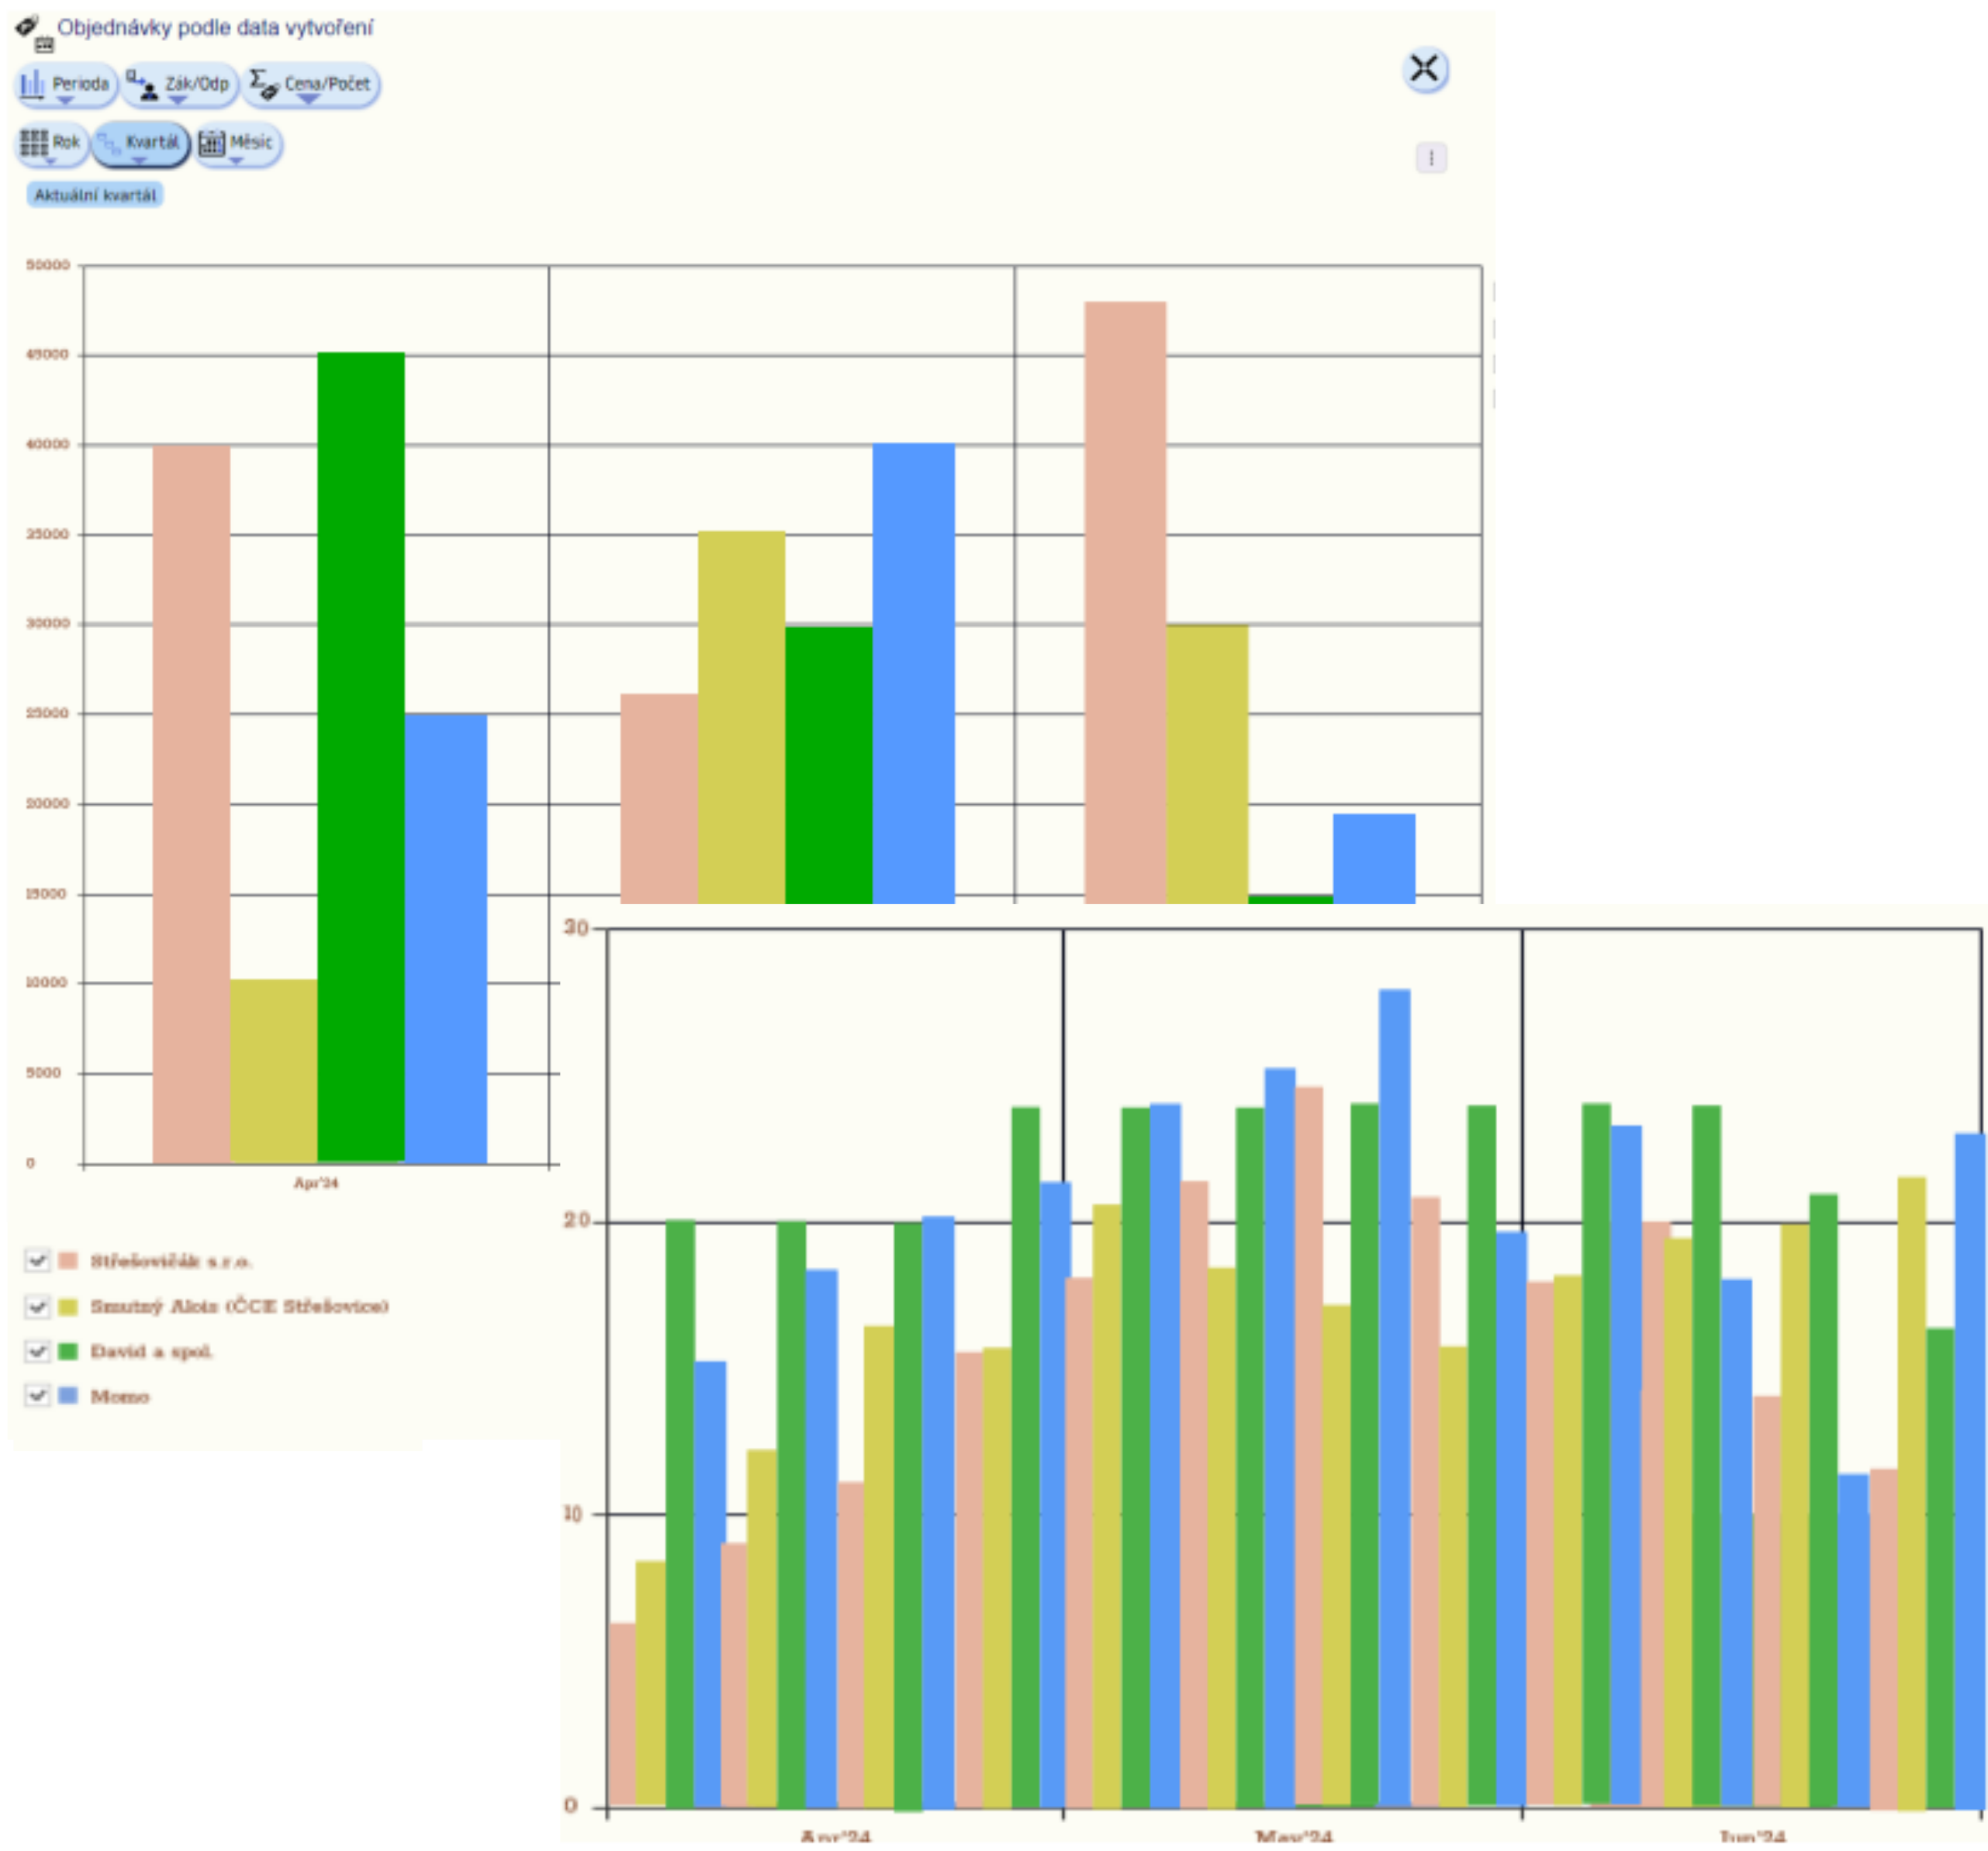
 Daily Work
- How many problems were solved by employees during the day?
- Who completed the most tasks, and how many?
- How many orders were placed during the day?
- Which customer has the most orders?
- Which products sell the most?
- ...
- Find the answers in column charts.
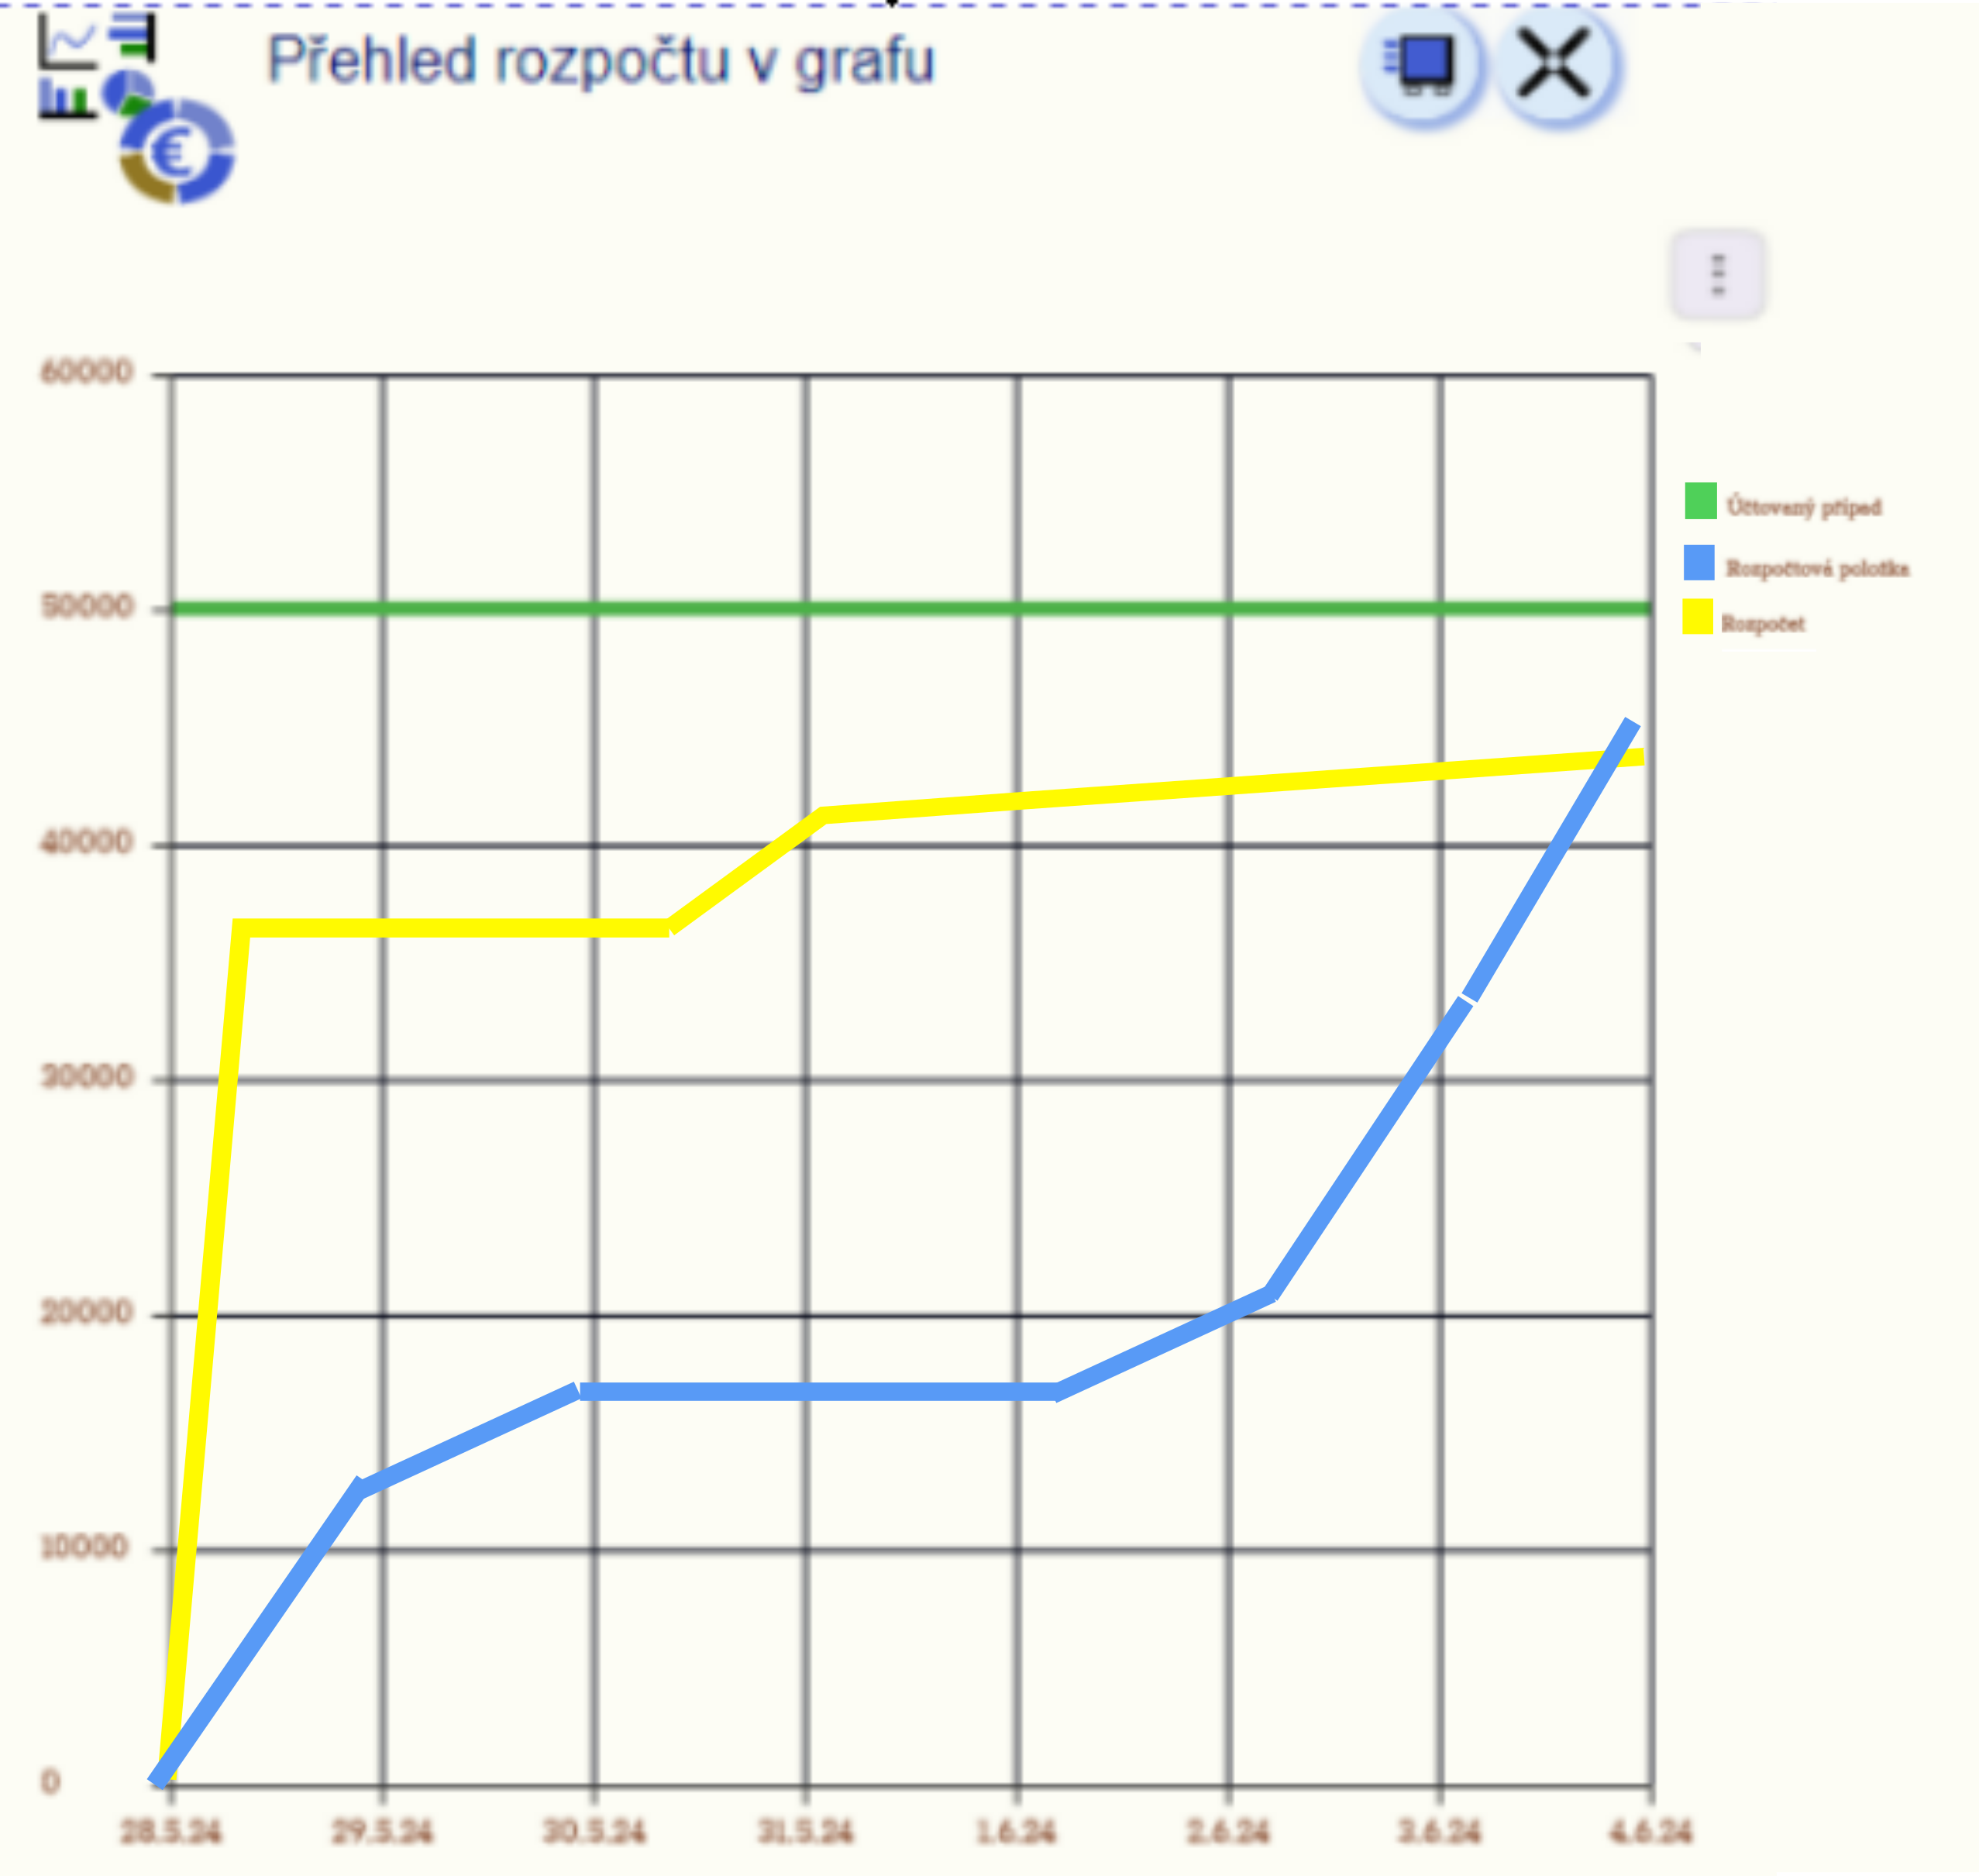
 Monitor Your Budget
- Are expenses staying within the budget?
- Compare expenses against the planned budget.
- Quickly assess budget adherence.
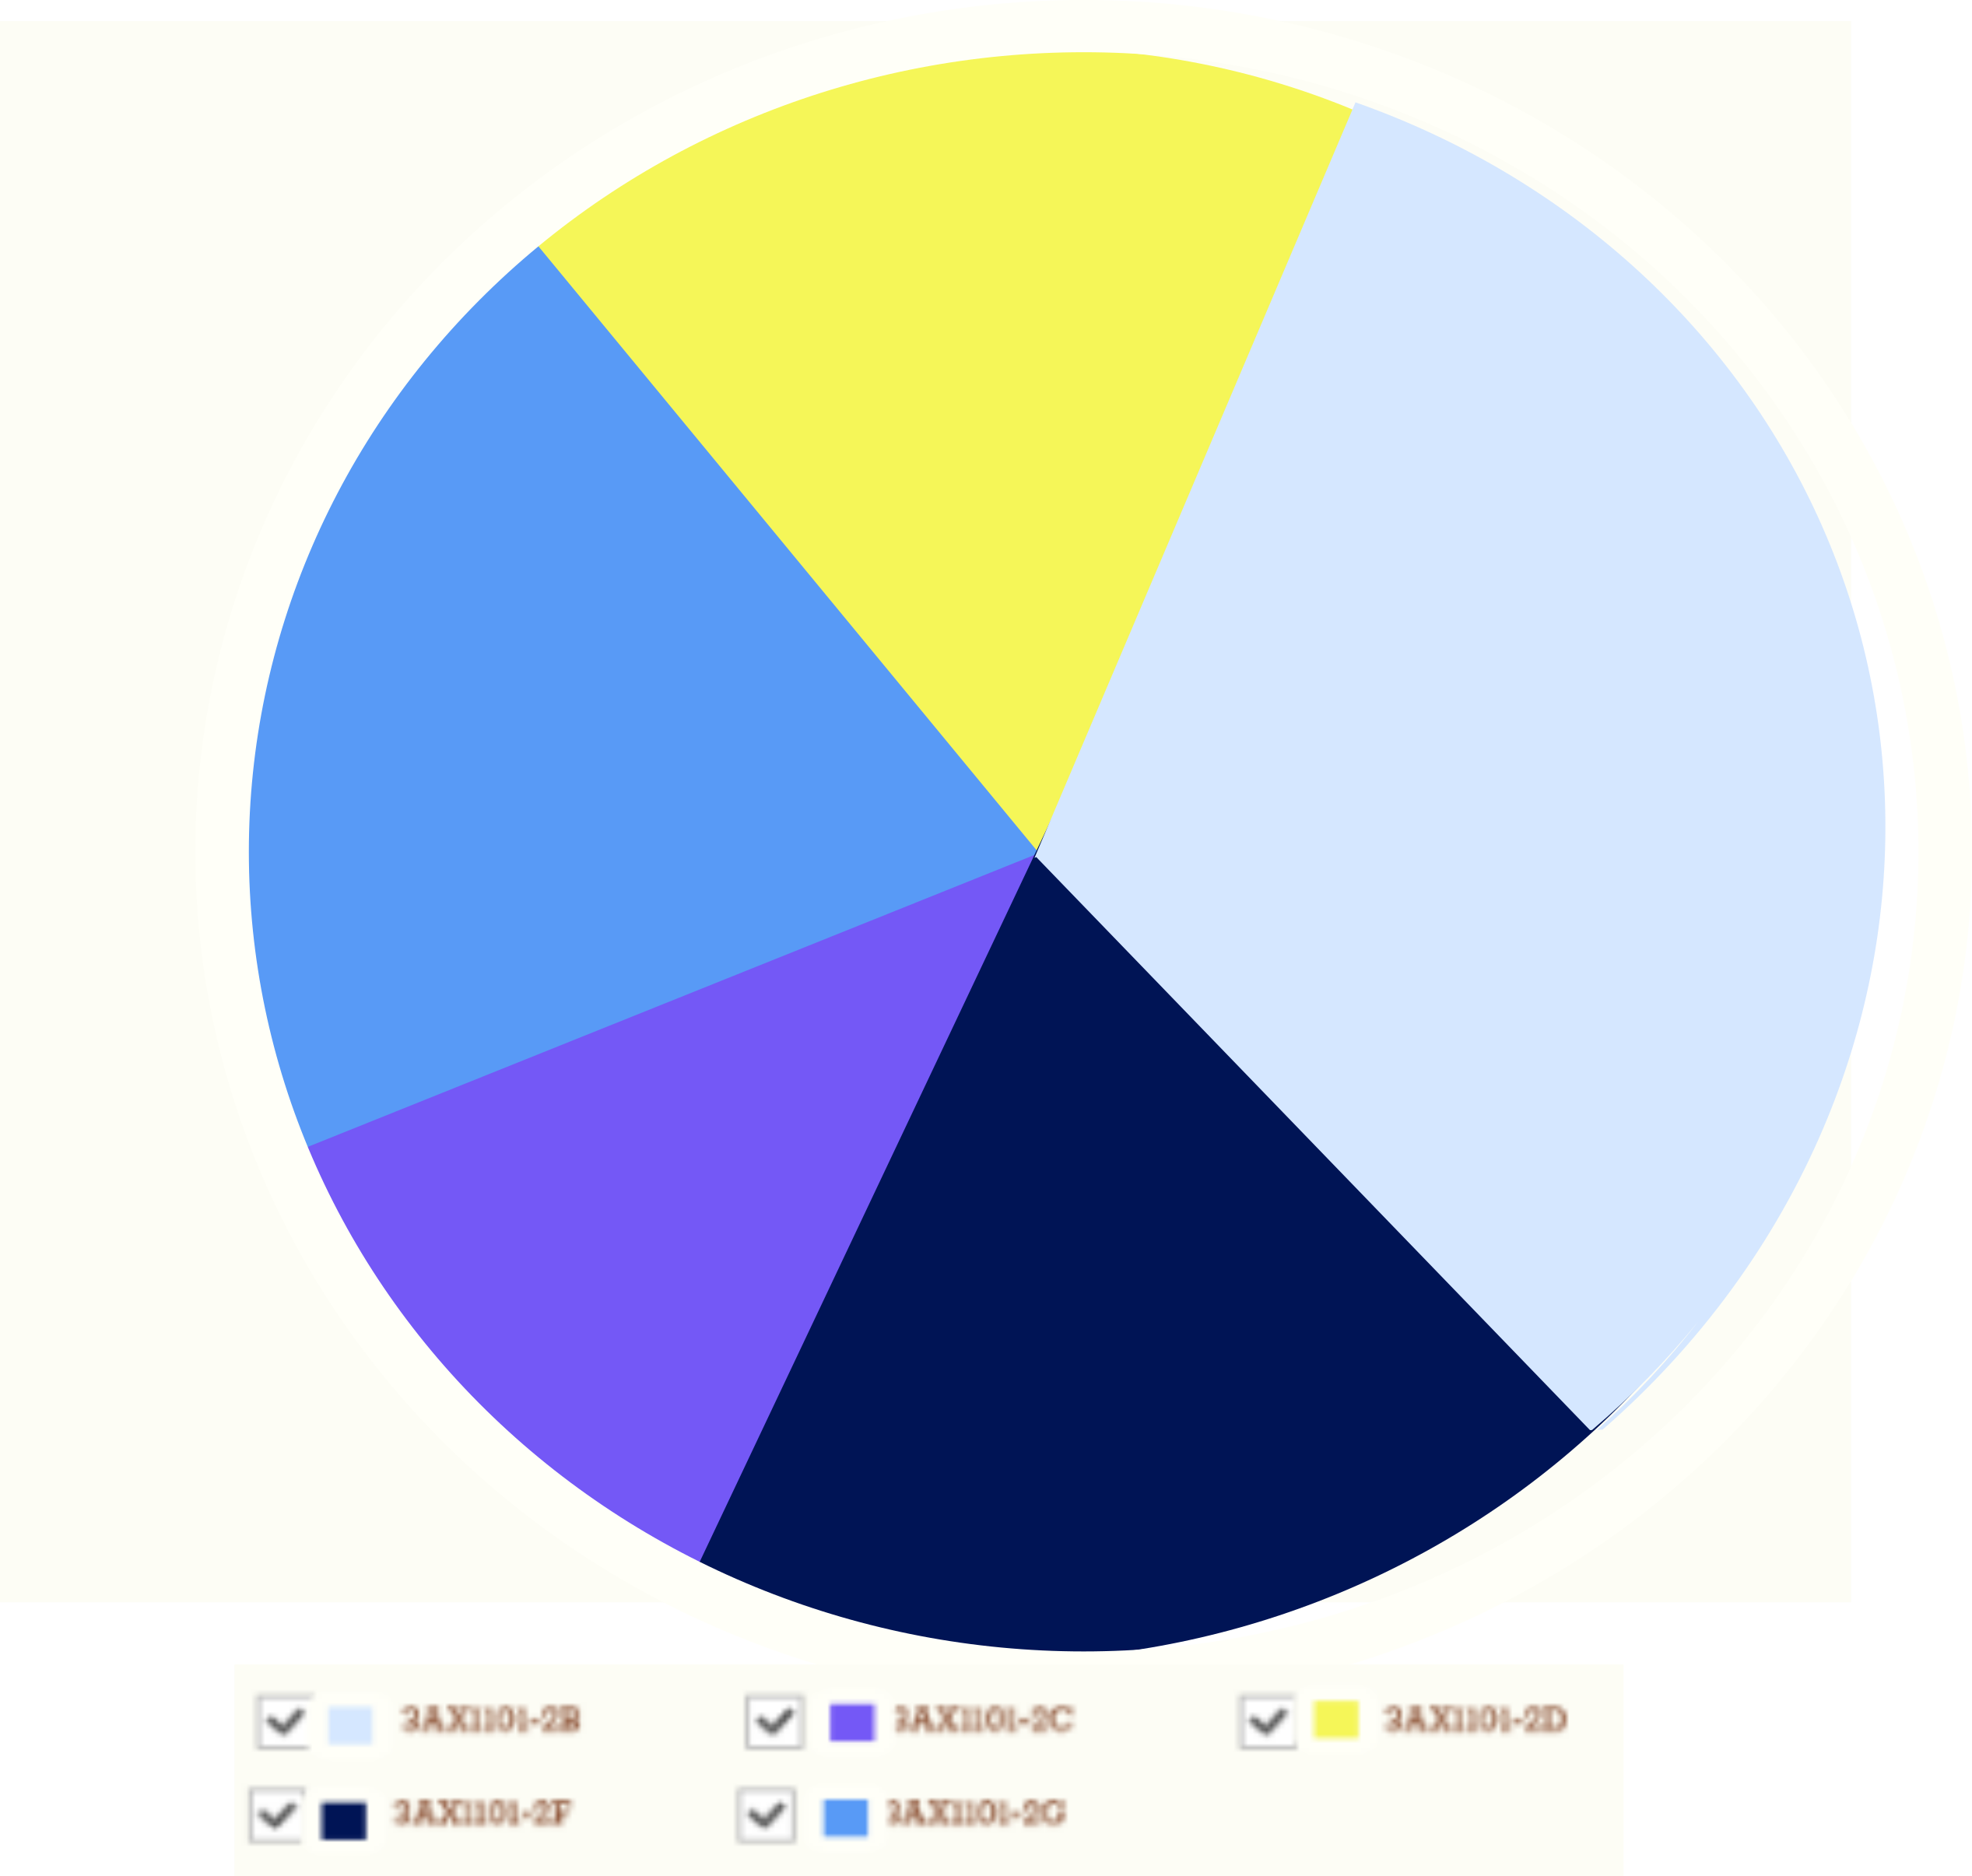
 Current Status
- Interested in which products are most purchased?
- Evaluating customer significance?
- What problems do customers most commonly face?
- Want to check the current status of a project? How many tasks are completed, and how many remain?
- How many issues are linked to the project? What still needs solving?
- ...
- Check the current status in pie charts.
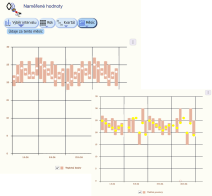
 Measured Intervals
- Charts for visualizing value intervals.
- Key values are highlighted.
- With AyMINE, monitor various measured variables and track their trends.
- Monitor values not only for products but also for storage conditions.

 Track Progress
- Charts for visualizing value trends.
- How do actual expenses compare to budgeted expenses?
- Are issues decreasing over the course of development?
- Are new orders increasing?
- ...
- Find the answers in the charts.
 CRM
CRM Information Management
 Task Management
 Orders and Offers
 Asset Management